User Tools
Use Marketing and Sales to Drive New Customer Acquisition
Help with this Page
This is a bottom-up technique for predicting during your planning stage how much revenue your company will make. It works by you stating certain assumptions about how you obtain and retain customers, and about how much revenue you will make per customer. Once you start leading your company, you will refine these assumptions so you can obtain a more accurate understanding of expected revenues.
Fundamental to understanding how this revenue-prediction technique works is understanding that revenue growth can occur in only three ways:
- You can spend marketing and sales dollars to attract new customers. This is called the paid growth model; it is also called customer acquisition or prospecting.
- You can take actions that cause existing customers to spend more. This is called the sticky growth model; it is also called organic growth.
- Your current customers can refer others to become customers. This is called the viral growth model.
Every company will have components of all three growth models. When you plan your company, you will make assumptions about how all three growth models work by defining values for key assumptions as follows:
- Assumptions about the Paid growth model
- Expense Item: Some new customers will become new customers as the result of your direct efforts. Assuming that these direct efforts cost money, what are you spending this money on? Pay-per-click advertising? Postage? Purchased email lists? Just make sure that this is an expense items you have already defined in your list of expenses that has been allocated to marketing and sales.
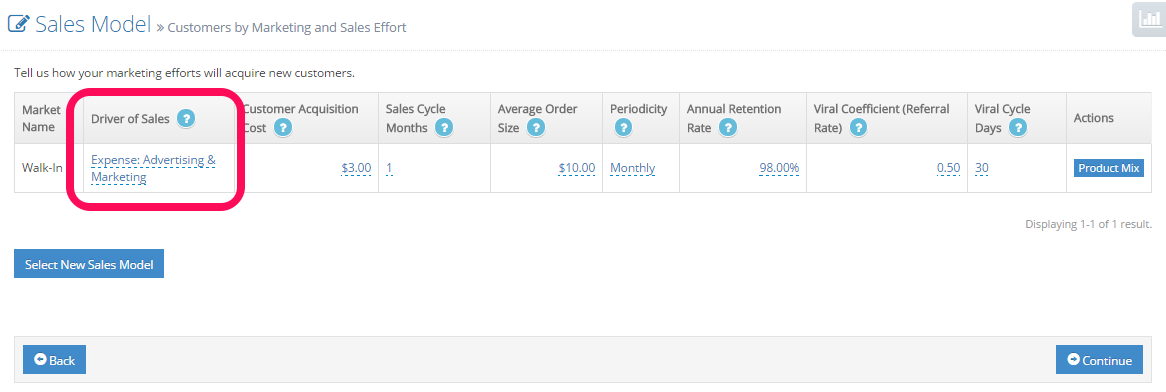
Or is it easier for you to think of this effort as labor rather than dollars? If so, just set this assumption to a job title. Again, just make sure that this is an employee you have already defined in your list of personnel that has been allocated to marketing and sales.
- Customer Acquisition Cost (CAC):
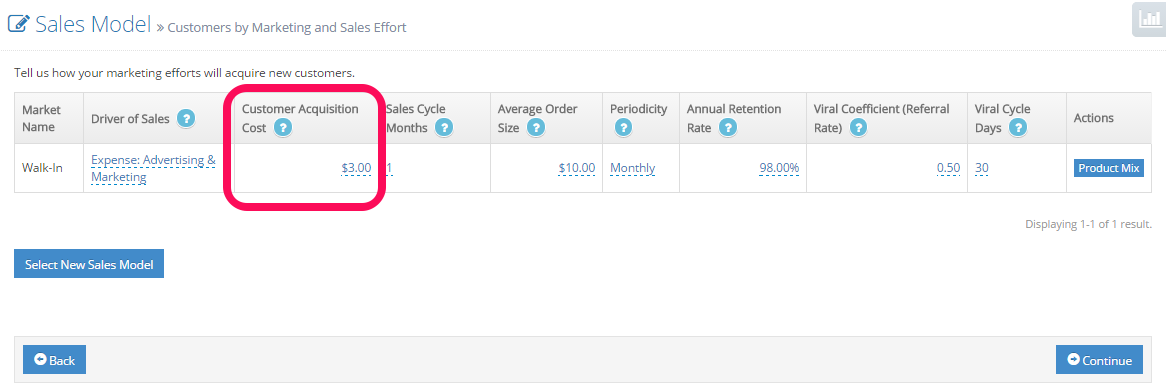
For those new customers that you attract, how much does it cost you per customer? Note that the previous assumption (dollars spent on the expense item or base salary earned by the employee) divided by this assumption equals the number of new customers you will attract in a given time period.
- Sales Cycle:
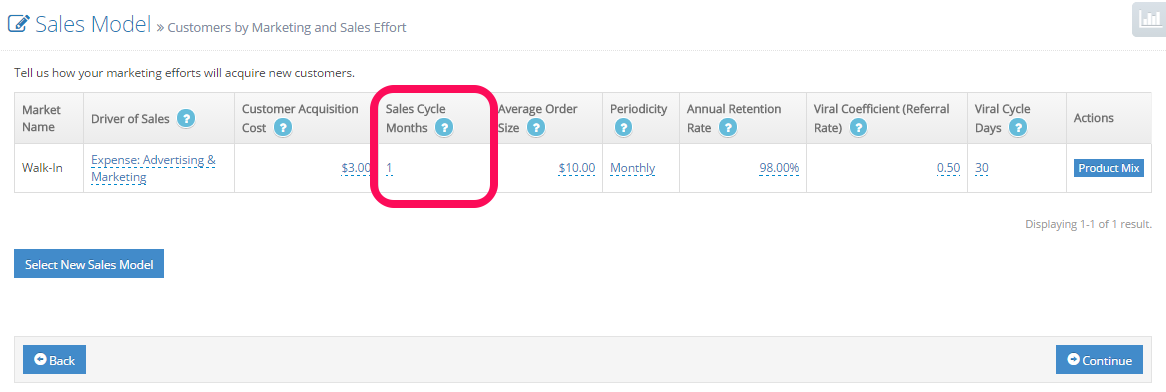
How many months transpire between your expenditure and the acquisition of new customers?
- Assumptions about the Sticky growth model
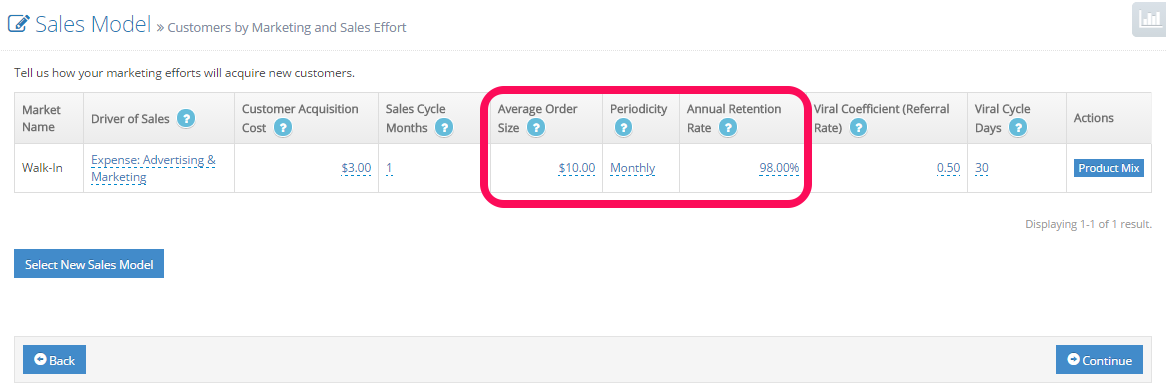
- Average Order Size (AOS): How much revenue do you expect to generate each time a customer makes a purchase?
- Periodicity: How often will each customer make a purchase?
- Retention Rate: What percent of existing customers will remain customers at the end of each year?
- Assumptions about the Viral growth model
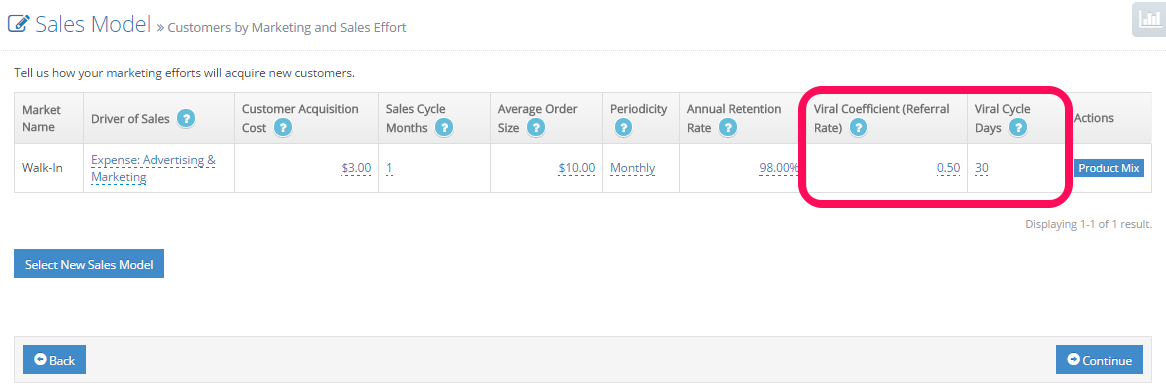
- Viral Coefficient: How many people will each existing customer attract and successfully convert into new customers? This is a one-time conversion; once a customer refers this many new customers, we assume they no longer refer more new customers.
- Viral Cycle Length: How many days will transpire between a customer becoming a new customer and his/her referrals becoming new customers? Warning: It is rare for this to be less than 30 days.


Additional Questions
How changing each item on this screen affects values on the income statement?
If you are unhappy with values on the income statement, here is how changing each of the numbers on this screen will affect numbers on the income statement:
- Expense Item or Employee Type: Increasing (decreasing) dollars allocated to this expense item (on the Assumptions/Costs/Other Expenses screen) or the salary for this employee type (on the Assumptions/Costs/Personnel/Employees) will increase (decrease) units sold, number of customers, and revenues on the income statement.
- Customer Acquisition Cost (CAC): Increasing (decreasing) CAC will decrease (increase) units sold, number of customers, and revenues on the income statement.
- Sales Cycle: Increasing (decreasing) Sales Cycle will decrease (increase) units sold, number of customers, and revenues on the income statement for the first year only.
- Average Order Size (AOS): Increasing (decreasing) AOS will increase (decrease) units sold and revenues on the income statement, but will not affect number of customers.
- Periodicity: Extending, e.g., from monthly to quarterly (shrinking, e.g., from quarterly to monthly) periodicity will decrease (increase) units sold and revenues, but will not affect numbers of customers.
- Retention Rate: Increasing (decreasing) Retention Rate will increase (decrease) units sold, number of customers, and revenues on the income statement.
- Viral Coefficient: Increasing (decreasing) Viral Coefficient will increase (decrease) units sold, number of customers, and revenues on the income statement (usually quite dramatically!).
- Viral Cycle Length: Increasing (decreasing) Viral Cycle Length will decrease (increase) units sold, number of customers, and revenues on the income statement (usually quite dramatically!).
How can I achieve other effects on the income statement?
You may be unhappy with values on the income statement, but none of the above seem to have the right effect. Here are some other ideas:
- You want to increase (decrease) units sold but keep number of customers and revenue unchanged: Just lower (raise) the price per item on the Assumptions/Revenue/Pricing screen.
- You want to increase (decrease) number of customers but keep number of units sold and revenue unchanged: On the current screen change any of the values that increase (decrease) numbers of customers to the level you want. Next raise (lower) the price per item on the Assumptions/Revenue/Pricing screen and/or decrease (increase) Average Order Size on the current screen until the units sold and revenues return to their previous values.
- You want to increase (decrease) revenues but keep number of units sold and number of customers unchanged: Increase (decrease) Average Order Size on the current screen. Next lower (raise) price per item on the Assumptions/Revenue/Pricing screen until the units sold returns to its previous value.
- You want to increase (decrease) units sold and number of customers but keep revenues unchanged: On the current screen change any of the values that increase (decrease) numbers of customers to the level you want. Next lower (raise) Average Order Size on the current screen until the revenues return to their previous value. Finally manipulate the price per item on the Assumptions/Revenue/Pricing screen until the units sold reach their desired values.
- You want to increase (decrease) revenues and number of customers but keep units sold unchanged: On the current screen change any of the values that increase (decrease) numbers of customers to the level you want. Next manipulate Average Order Size on the current screen until the revenues achieve desired values. Finally increase (decrease) the price per item on the Assumptions/Revenue/Pricing screen until the units sold reach their desired values.
- You want to increase (decrease) units sold and revenues but keep number of customers unchanged: Increase (decrease) Average Order Size or shrink (extend) periodicity on the current screen until revenues achieve desired values. Then manipulate the price per item on the Assumptions/Revenue/Pricing screen until the units sold reach their desired values.
How can I have customers but no revenues?
Three possible reasons: Price could be zero, Average Order Size could be zero, or Periodicity could be indicating that current customers do not purchase every month.
Why are my marketing and sales expenses so high when I use this sales model?
This usually occurs when you combine commissions with viral sales! You are paying commissions on all sales, yet a large percent of your revenues are probably coming from referrals for which the sales people are doing much less work. On the other hand, perhaps they do deserve commission for these sales because they did work to get the initial seed customer in the door. Our suggestion is that you lower your commission rate or eliminate it altogether when using this sales model.
Other Related Questions:
What is a sustainable growth engine?
How can I model the paid growth engine?
How can I model the sticky growth engine?
How can I model the viral growth engine?
Why can't I find an expense type on the drop down list?
Are commissions used in calculating customer acquisition cost (CAC)?
How do I change assumptions when I pivot?
How can I drive revenue growth via paid marketing and sales?
How can I drive revenue growth via sticky strategies?
How can I drive revenue growth via viral strategies?
How do I show a different AOS each year??
How do I add a market to the sales model?
Why are my revenues 5.5 (or 6) times higher than what I think they should be during the first year?
Why are my revenues 6.5 times higher than what I think they should be during the first year?
Why are my revenues 12 times higher than what I think they should be?
Why are my revenues 92% lower than what I think they should be?