User Tools
Predict Market Penetration by Month
Help with this Page
This is a top-down technique for predicting (during your planning stage) how much revenue you think your company will make. This is a favorite among many so-called “marketing experts” because it falls naturally out of performance of market research, so it sounds scientific. However, its only value is to establish an upper bound on how much revenue your company could make theoretically. It has two major problems: (1) it completely ignores the most important aspect of revenue planning, i.e., how are you going to reach your potential customers, and (2) it lends itself well to suckering people into believing stupid revenue numbers by supporting claims like “look, all we have to do is capture ½ of 1% of the total available market, and we will all be rich!”
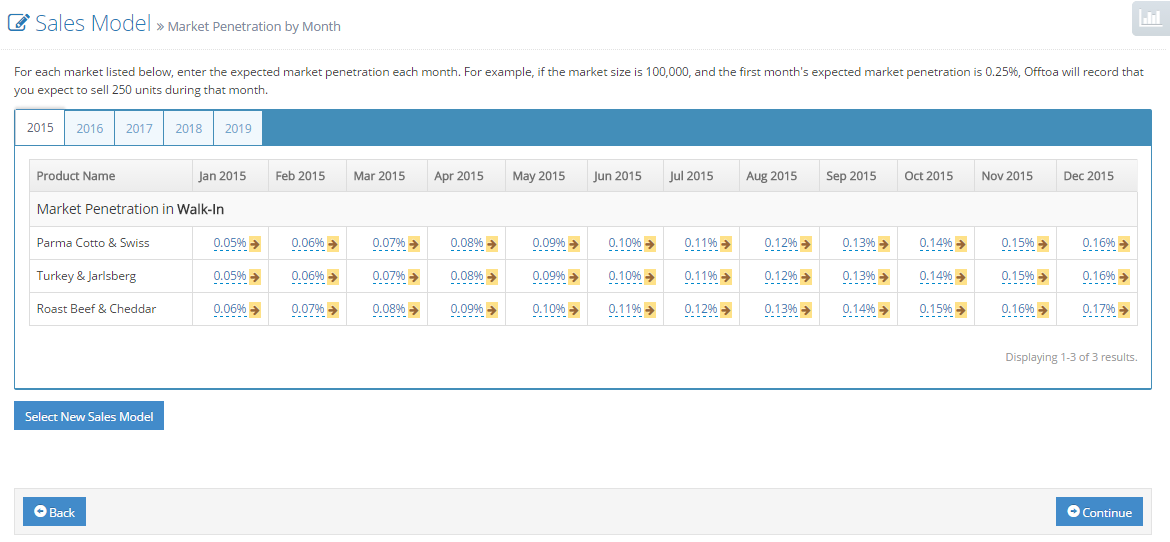
As long as you understand the limitation of this technique, and supplement it with a bottom-up revenue-forecasting technique, fell free to use it. To use it, you should estimate the percentage of the market you think you can reasonably capture each month for each product and each market in the figure below:
If you want to propagate a value from any cell to the right, click on the black and yellow arrow.
Note that the term “market” is not particularly specific. If you choose to use it with its broadest possible interpretation (e.g., the population of Gen-X-ers in the United States, or the number of small software companies in New York), then you should expect your predicted target penetrations to be quite small. On the other hand, if you use it in a very specific sense and limit it to a very narrow vertical (e.g., Gen-X-ers who are members of public golf courses in Colorado, or software project managers in Fortune 500 companies), then you should expect your predicted target penetrations to be much larger. Assumptions you want to record when using this sales modeling approach (for each product and each market) are:
- Market size. Current number of customers in the market, or alternatively, the number of products that could be absorbed by customers in the market. Whichever one you select as your definition of market size, you must remain consistent throughout the rest of the model.
- Average order size: If market size was specified as numbers of customers, then “average order size,” is the average number of units you expect each customer to purchase per month; if market size was specified as numbers of products that could be absorbed, you may ignore this assumption.
- Annual rate of growth of market. At what rate do you expect the market to grow each year? If you expect the market to shrink by 10% per year, record this assumption as minus 10%.
- Market penetration. What percent of the market do you expect to have as your customers by month? This will be an array of assumptions, one for every product in every market during every month.
Note that defining market size (as number of customers), average order size, annual rate of growth, and market penetration per month provides sufficient information to predict how many units will be sold by your company. Defining market size (as number of products), annual rate of growth, and market penetration per month provides sufficient information as well.
Additional Questions
Should I use top-down revenue forecasting?
Absolutely! This is a perfectly acceptable sales modeling technique to demonstrate what percent of the total available market you expect to capture. But always supplement it with a bottom-up approach, which shows your real revenue forecast and demonstrates you know how you will be capturing your market. When the top-down and the bottom-up meet in the middle, people start to believe you.
What other ways exist to model sales?
How do I add a product to the sales model?

