User Tools
Cash Balance Chart
How to Read a Cash Balance Chart:
The Cash Balance Chart is a graph of the bottom line (Cash at End of Period) of the monthly cash flow diagram. It thus plots how much cash your company has at the end of each month during the period that you have chosen to examine. As long as the graph remains above zero, your company is “alive.” If at any point in time the graph dips below zero, you will need to do something. A complete list of possible actions can be found by examining your cash flow statement and then pressing Analysis Findings at the bottom of your screen, but the most common solutions are to increase revenues, loans, or investments.
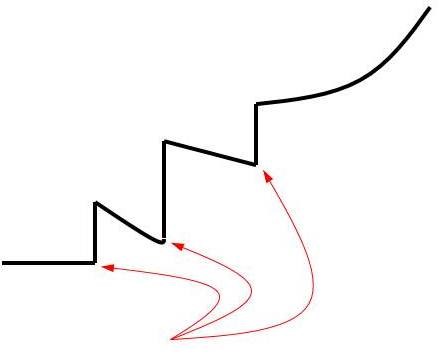
The diagram below shows the most common shape for a cash balance chart for a company receiving a series of investments or loans before it “takes off” with its own revenues. The three vertical segments of the graph correspond to infusions of external cash (from investments or loans) occurring at the points of the three arrows. Notice of the graph segments between these cash infusions; each demonstrates successively higher slopes indicating increasing self-sufficiency (and thus financial strength) of the company. Finally, after the third infusion of cash (in this case), the company's cash increases as the result of its own operations.

Questions:
What should I do if the cash at the end of a period is negative?
- See blog post, How to a Company Gets Cash.
