User Tools
Cumulative P&L Chart
How to Read a Cumulative P&L Chart:
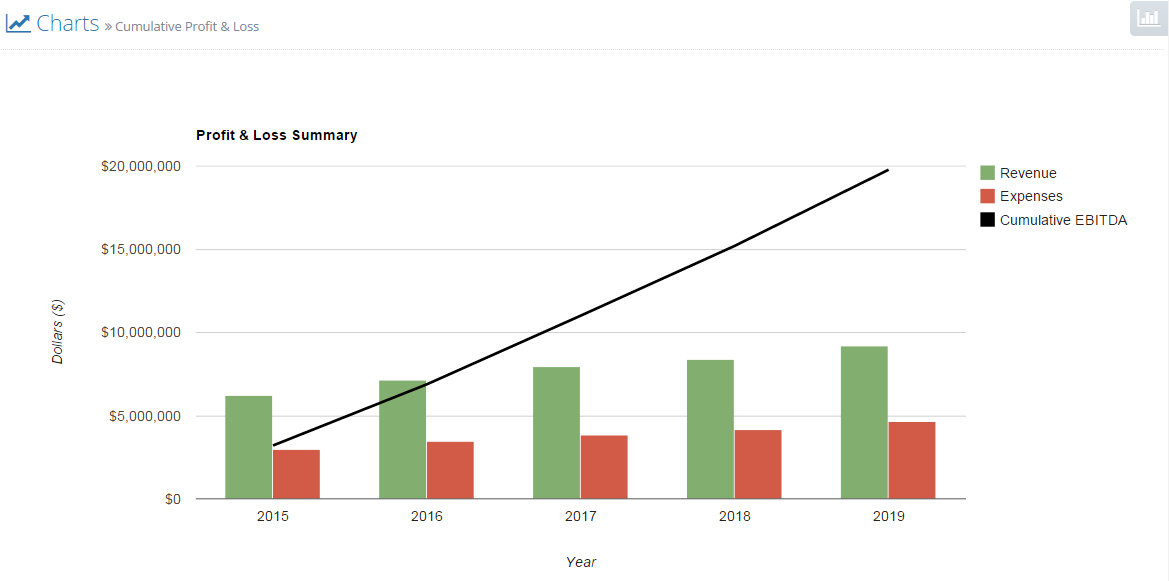
A cumulative P&L chart plots annual revenues and annual expenses* (usually as columns) for each year. It thus enables you to see visually when revenues exceed expenses. In addition, the chart usually also superimposes a line graph displaying cumulative EBITDA, so the observer can quickly see the breakeven point (i.e., where this line graph moves from negative to positive is where the company has finally earned sufficient revenues to offset all startup costs).
Here is an example:
*Expenses shown are all costs of goods sold plus all expenses

